
Designing a Water Filter
Upon learning that many of their water samples may be impure, students are motivated to devise a solution to contaminated drinking water. This desire to solve the problem of “dirty water” is the impetus for our water filter engineering design challenge. Students observe a commercial water filter in action and participate in a whole-class discussion to make predictions concerning how and why it operates successfully. Then, they are challenged to design, build, and test their own working water filters.
Each student begins with a clean, empty plastic bottle with the upper section removed and turned upside down, which serves as the filter’s main structure. They have access to several other materials, including cotton balls, aquarium gravel, paper towels, sand, coffee filters, calcium carbonate, sodium bicarbonate (baking soda), and activated charcoal, though they are not required to use every material and can use the same material in more than one of their filter’s media layers (Ehlers and Coughlin 2015). Each student designs their first water filter prototype using the Google Drawings app or paper and pencil, sketching and labeling their water filter diagram. Allowing students to use either the digital platform or paper and pencil gives them a choice regarding how they wish to create and present their ideas and accounts for students with various learning requirements. Once their diagrams are complete, students build their first prototypes. They work individually to carefully place their choices of filter media in the inverted portion of the soda bottle in the amount and order outlined in their plans. Remote students are allowed to choose from any of these materials that they have on hand or choose their own materials and have them approved.
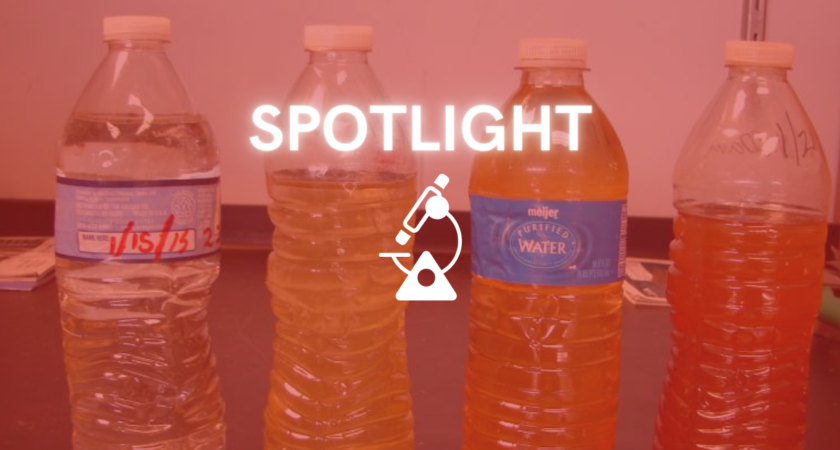
Before filtering their water samples for the first time, students make observations concerning the quality of their “contaminated water,” which consists of water mixed with graphite powder (a safe substitute for lead), coffee grounds, potting soil, cooking oil, and green food dye. (Students working remotely can create their own contaminated water using approved substances of their choice.) They create observational drawings of their “dirty” water samples using either Google Drawings or paper and pencil. Students also use pH strips to find the pH of their contaminated water samples prior to filtration. Then, they eagerly pour the contaminated water into their structures, watching it pass through the various layers of filter media. They compare the filtered water to the contaminated sample, making new observational drawings and using pH strips to find the pH of their filtered water sample. (Students wear safety goggles and gloves when building and testing their water filters.)
When reflecting on their first prototypes, students consider the questions: “Does my water look cleaner? Was I able to bring the water’s pH closer to neutral?” Based on these findings, they redesign their filtration systems, build second prototypes, and repeat the testing procedure. When sketching and labeling their second prototypes, students must explain what is different about their second filter compared to their first filter, as well as their reasoning behind these choices. Then, they use the data collected from testing the two water filters to answer the following questions:
Was Filter #1 or #2 more successful at removing contaminants from the water? Why?
What did you notice about your water sample as it passed through layers of larger material? What did you notice about your water sample after it passed through layers of smaller material?
Students make several connections between their choices of filter media and the order of their filter media when responding to these questions, observing that different materials filter different types of contaminants with varying amounts of success.
Making Connections with the New York City Department of Parks and Recreation
While students are engaging in the water filter engineering design challenge, they also receive a virtual visit from Jeff Botula, a civil engineer with the New York City Department of Parks and Recreation. Mr. Botula helps make connections between their own water filters and the many “rain gardens” found throughout the city. The New York City Department of Environmental Protection’s website states: “On rainy days, our sewer system has to collect the water that goes down the drain in our homes (we call it “wastewater”) and the water that falls as rain on our streets and sidewalks (we call it “stormwater”). If it rains enough, our sewers can fill to capacity and a mix of wastewater and stormwater can end up going into our local waterways (we call these events “combined sewer overflows”). Rain gardens are important because they collect and absorb stormwater before it can enter our sewer system. When we prevent stormwater from going into our sewer system, we’re reducing the amount of combined sewer overflows that enter our local waterways.” With Mr. Botula’s support, students learn that rain gardens use the same materials as their own filters, such as gravel, to both decrease the rate at which stormwater empties into the sewer system and filter out pollutants from the water. This gives students a tangible example of a “real life” water filter and how it is used to keep the city’s bodies of water clean and healthy.
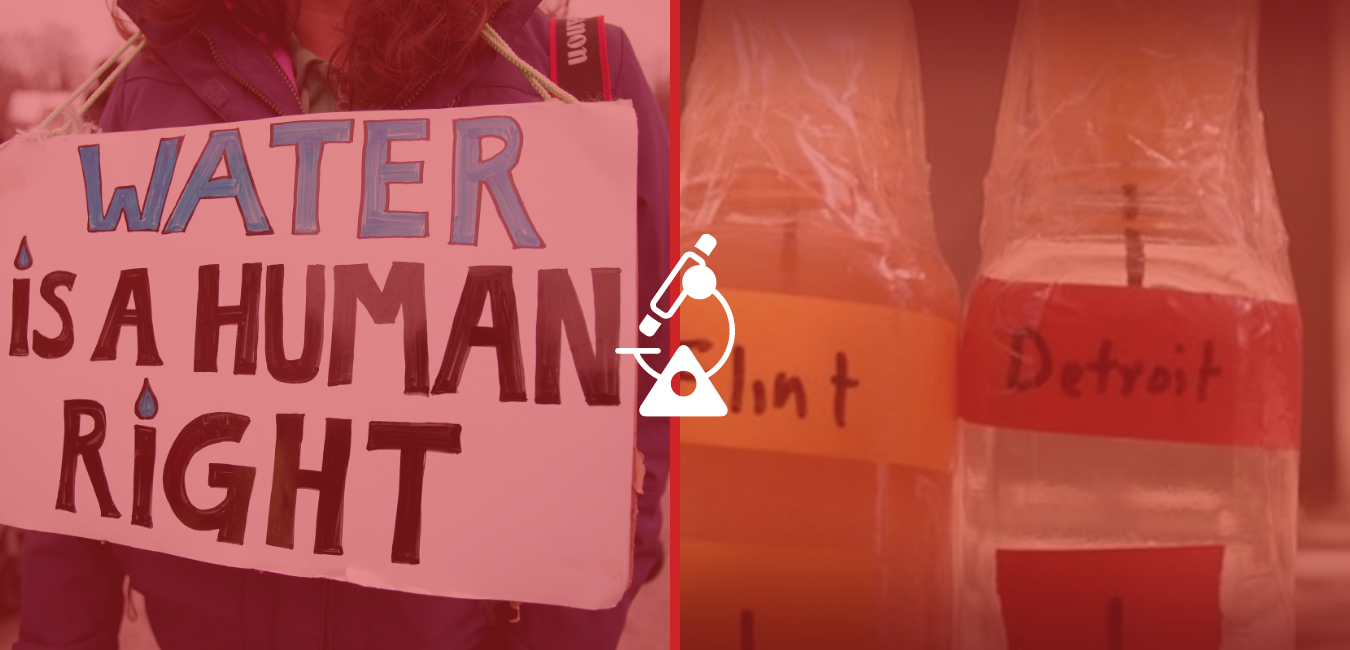
Water Quality and Social Justice
At this point in the unit, students are ready to examine the relationships between drinking water quality and social justice issues by pondering the questions: “Who has access to clean water in New York City? Who does not? Why?” Students work in collaborative groups to compare and contrast maps of the city’s five boroughs showing poverty rates, racial demographics, and lead content in water by neighborhood while recording their noticings on a Google Jamboard. (Those working remotely use the video conferencing platform’s breakout room feature to conference with students in the classroom.) Using these sources, they are able to make meaningful connections between residents’ income, discrimination towards marginalized peoples, and water cleanliness in our city.
Students’ written reflections show a thoughtful understanding of issues surrounding water equity:
“If you are in poverty, you will most likely have to live in an area where there are bad pipes with contaminants in the water. If you are wealthy and have the option to live in a neighborhood where there is clean water or a building where there is lead in the water, I think that you would definitely choose the clean water neighborhood.”
“Having access to clean water is very important. If you don’t have access to clean water, it can cause serious health problems, and possibly death. It’s really dangerous because there are some stereotypes that can cause some people to be treated unfairly, and even dangerously. No one should be mistreated because of their race, gender identity, sexuality, or anything else, because everyone deserves to stay happy, healthy, and thriving.”
Additionally, they use their newfound understanding of the importance of water filtration to argue that everyone should have access to effective and affordable water filters.
Using System Models to Show Our Learning
One of the eight Science and Engineering Practices in the Next Generation Science Standards (NGSS Lead States 2013) is “Developing and Using Models.” According to the NGSS, “In science, models are used to represent a system (or parts of a system) under study, to aid in the development of questions and explanations, to generate data that can be used to make predictions, and to communicate ideas to others.” As students near the end of the unit, they synthesize and exhibit their learning about water contamination and water quality in New York City by creating interactive models using SageModeler, a free, web-based systems dynamics modeling tool.
Students begin the process of creating their models by reflecting on the question, “What are the causes and effects of lead contamination in drinking water?” They start by considering the variable “amount of lead contamination in drinking water” and use their newfound knowledge to map out the causes and effects of this phenomenon in their models (at least five of each). Students refine their models as they are posed with the questions: “How can we show the relationship between the pH of a tap water sample and water contamination? How can we include humans in this model by considering the equity and social justice issues related to clean water access and the negative health effects of contaminated water? What else have you learned over the course of this unit that can be included in your model?”
Once they have added the causes and effects of drinking water contamination to their models, students focus on using arrows to illustrate the relationships between these variables. When adding arrows to their models, students are expected to include arrows that accurately point from causes to effects. Then, they classify each relationship represented by an arrow as either “increasing” (represented by red) or “decreasing” (represented by blue), depending on the variables on either side of the arrow. For example, one student’s model shows that the more acidic tap water is, the more likely it is that the tap water will contain lead. The same model shows a direct relationship between the amount of lead in tap water and issues such as exhaustion, memory issues, and hearing loss.
When refining their models, students have the opportunity to work in collaborative groups in order to improve the accuracy of their models as well as provide feedback regarding their classmates’ work. (As before, remote students can use the video conferencing platform’s breakout room feature to conference with students in the classroom.) Once completed, these models serve as effective summative assessment tools that allow me to determine which concepts the students have mastered over the past several weeks.
https://sagemodeler.concord.org/
Conclusion
At the beginning of this unit focusing on water quality in New York City, it is clear that most students in my fourth grade science class have never considered where their drinking water comes from or whether it is always safe to drink. After using the concept of pH to investigate water quality in various areas of New York City, building and reflecting on the efficacy of their water filters, discussing the relationship between social justice and drinking water access, and creating models to illustrate their understanding of these concepts, students become experts on drinking water safety and access. They will never look at a glass of water the same way again now that they have the knowledge and skills necessary to “think and drink critically.”
Part 3 of 3
If you cant wait read the full article at at Juliette Blog.
Acknowledgments
Special thanks to Abby MacMillan, who collaborated in the planning and implementation of this unit of study; Cynthia McIntyre, who edited this piece; Steve Roderick, Dan Damelin, and the other members of the team at Concord Consortium, who provided me with extensive support in using SageModeler with students; Jeff Botula and the rest of the SPARKS! team at the New York City Department of Parks and Recreation; and Yadana Nath Desmond, Executive Director at STEMteachersNYC.