
by Juliette Guarino Berg
Understanding the Causes of Drinking Water Contamination
To delve deeper into the unit’s driving questions, we start with the concept of pH, or “power of hydrogen.” Students review a graphic illustrating the pH scale and learn that substances can be classified as acidic, neutral, or basic. They explore the question, “What makes something an acid or a base?” by watching the video “Chemistry Basics: What Are Acids and Bases?” (American Chemical Society). Students learn that acids contain positively charged hydrogen (H+) ions and bases contain negatively charged hydroxide (OH-) ions. To reinforce the concept that stronger acids contain a greater number of hydrogen ions while stronger bases contain a greater number of hydroxide ions, students color and cut out graphics representing both types of ions and use the handout with the pH scale to illustrate their distribution among substances of varying pH.
https://www.vecteezy.com/vector-art/293102-the-science-ph-scale
With this background, students are ready to find the pH of various liquids. They first perform a virtual pH investigation with a PhET Interactive Simulation to “test” the pH of several substances, from battery acid to water to drain cleaner. This virtual activity allows students to become familiar with identifying acids, bases, and neutral substances, as well as differentiating between weak and strong acids and bases.
https://phet.colorado.edu/en/simulation/ph-scale-basics
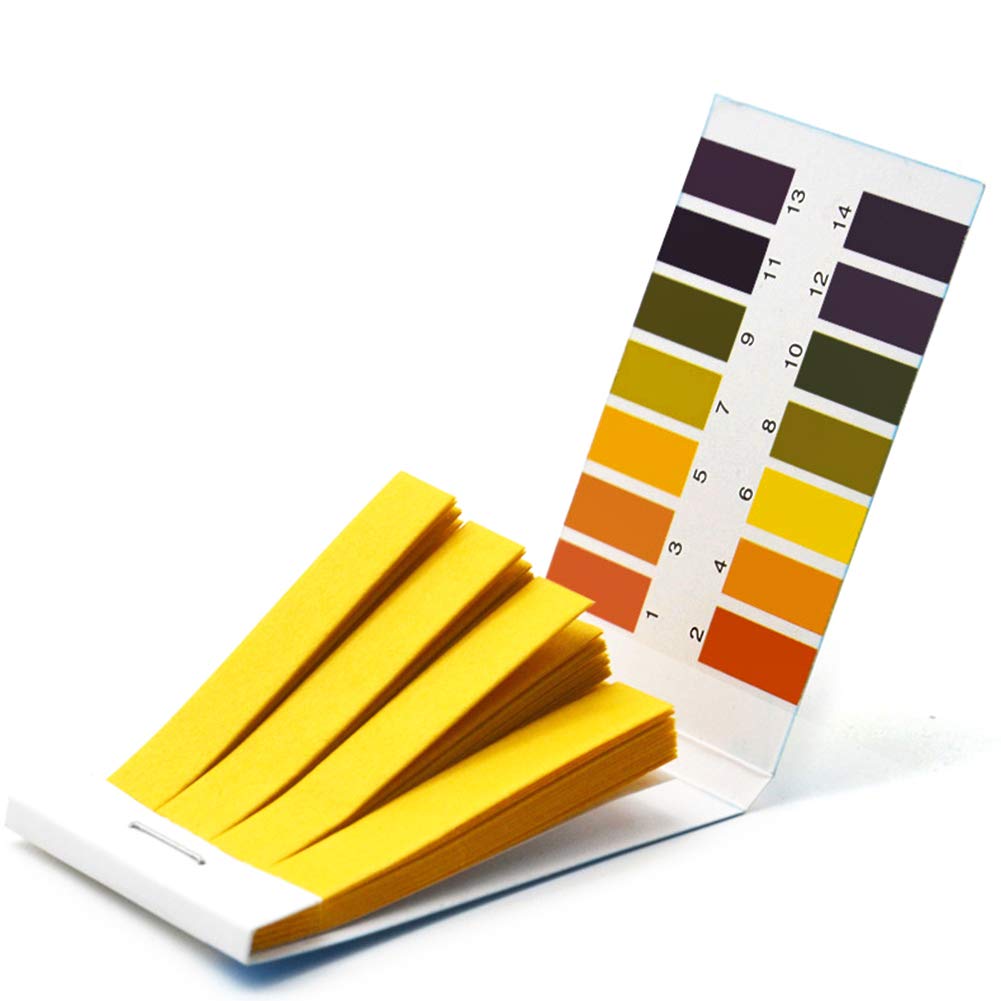
Students are then presented with six “mystery liquids” (black coffee, Milk of Magnesia, fresh lemon juice, soda, tap water, and dish soap) and challenged to identify each substance by using their senses of sight and smell and finding its place on the pH scale. (All substances are safe to touch and smell; students wear safety goggles and are instructed not to drink any liquid.) They work in pairs to predict whether each substance is acidic, neutral, or basic, then use the pH strip reference graphic and the final color of the substance when combined with cabbage juice indicator to determine pH (Carolina Biological Supply Company). After the investigation, the identities of the six “mystery substances” are revealed. Since students learn that pure water is neutral (exactly 7 on the pH scale), many are surprised that their tap water samples are either slightly acidic or basic.
Upon finding that many of their tap water samples fall above or below 7 on the pH scale, students embark on an investigation of the question: “Is our drinking water pure?” In addition to testing the drinking water from various locations on campus, each student brings at least one water sample from their home or another location to school for testing. Prior to testing the pH and lead content of each water sample, students record where it was collected using their data tables. They are encouraged to be as precise as possible, especially when collecting multiple water samples from the same building (for example, “sixth floor water fountain” or “kitchen sink”). (Students working remotely collect as many water samples as possible from their current location.)
Next, students use water quality test strips to determine the pH and lead content of each of their collected water samples, recording their findings in their data tables. They are surprised to find that many of their water samples contain at least a small amount of lead and/or can be categorized as acidic or basic rather than neutral. They consider the question: “Why aren’t all of our tap water samples neutral, or exactly 7, on the pH scale?” Students are given the opportunity to reflect on this question and record their thinking using a Google Jamboard. Answers include:
“The faucet might be dirty.”
“Some chemicals can seep into the tap water.”
“Everyone has different answers because it’s tap water, not pure water.”

Most students conclude that substances are being added to the water at some point between its journey through the aqueducts and arriving in our faucets. Students make connections between the pH of water and its ability to leach metals from the surrounding environment, such as pipes.
After watching parts of a video entitled “We Tested NYC Water for Lead and the Results Were Confounding,” students begin to understand how and why contaminants like lead can be found in the city’s tap water. The video opens with this incredible set of facts: “Under New York City, 6,800 miles of pipes carry more than 1 billion gallons of water from distant reservoirs to city faucets every day. Most of those pipes are made out of iron and steel, but some of them are still made out of lead. It’s really easy stuff to make pipes out of, but it’s also toxic for humans. The city has made a lot of progress in reducing the number of lead pipes, but they still exist, and they can be a big problem for people living here” (Verge Science). Students are made aware of many of the effects of metal contamination on humans, including fatigue, digestive problems, hearing issues, joint pain, and memory difficulties.
Part 3 of 3 coming 10/24
If you cant wait read the full article at at Juliette Blog.
Acknowledgments
Special thanks to Abby MacMillan, who collaborated in the planning and implementation of this unit of study; Cynthia McIntyre, who edited this piece; Steve Roderick, Dan Damelin, and the other members of the team at Concord Consortium, who provided me with extensive support in using SageModeler with students; Jeff Botula and the rest of the SPARKS! team at the New York City Department of Parks and Recreation; and Yadana Nath Desmond, Executive Director at STEMteachersNYC.